Twenty thousandTEU discharged.Twelve hours early.
Every crane move, dwell minute, and reefer plug logged in real time. Asia–Europe rotations choose Berth because we show our numbers first.
Industry avg: 26.1 MPH
Industry avg: 4 avg
Industry avg: 16.0 m
Industry avg: 4.3 hrs
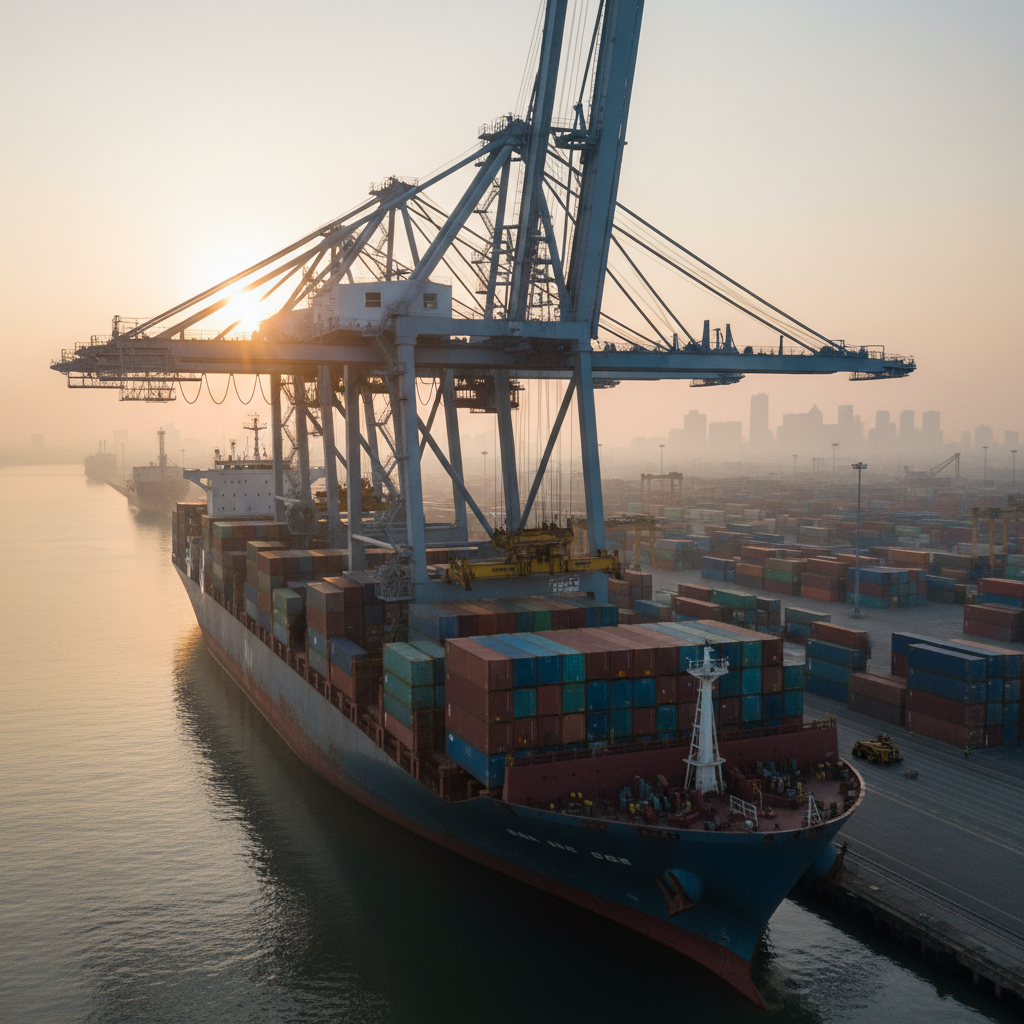
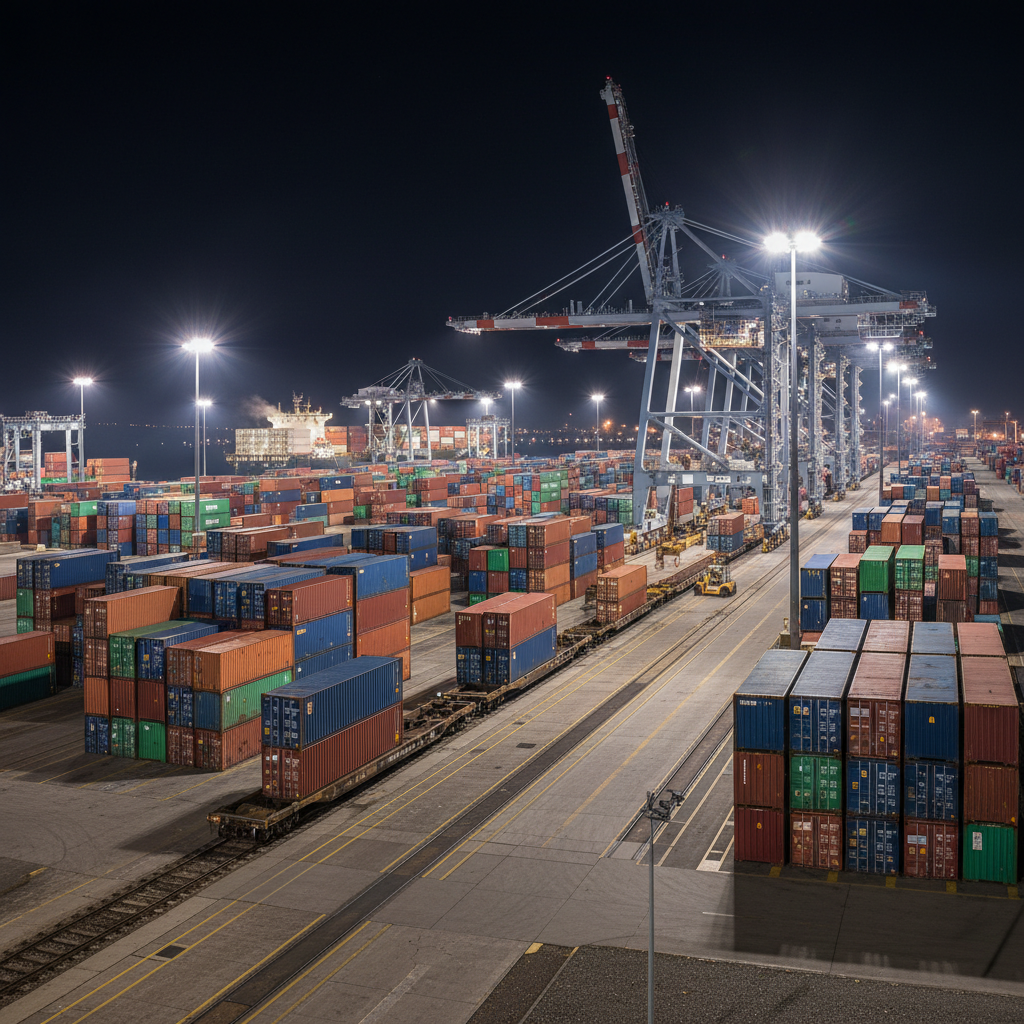
Ship-to-shore at 32.4 moves per hour — measured, published, guaranteed.
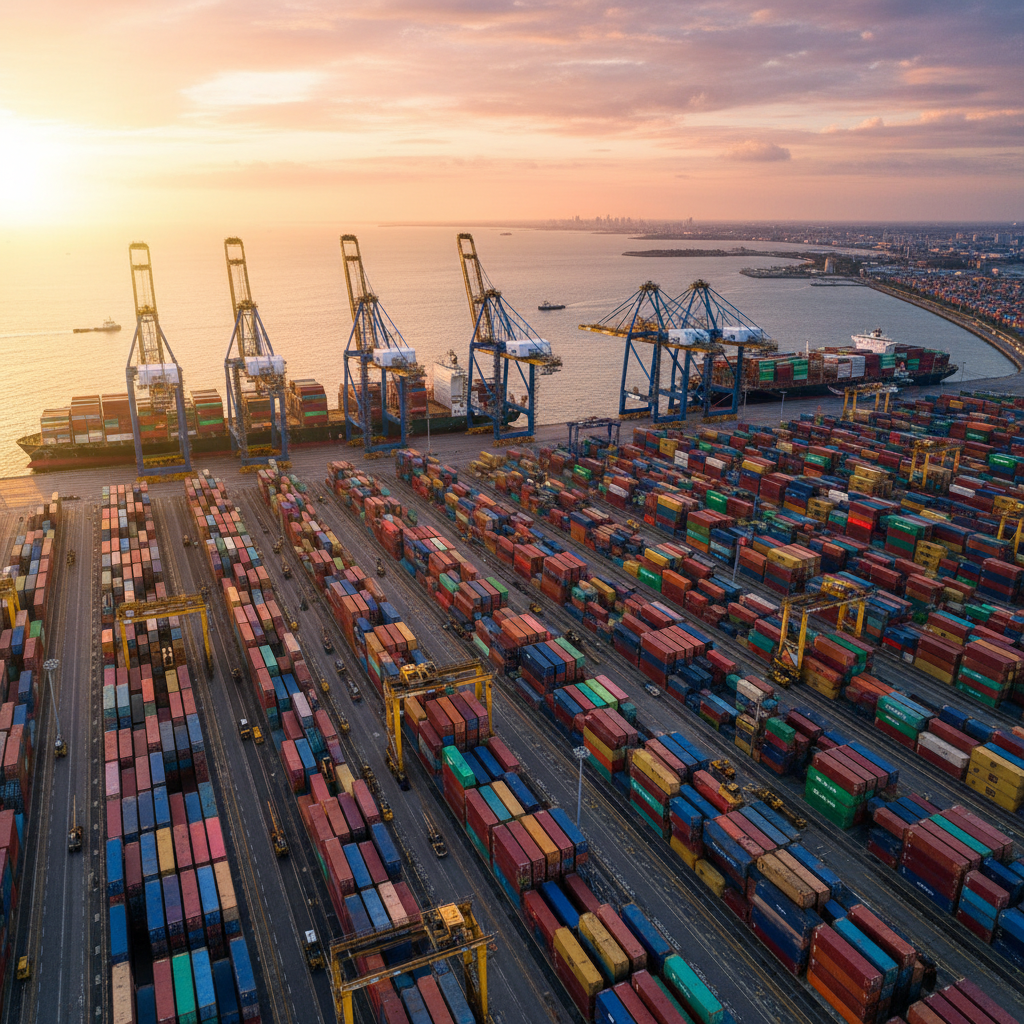
Six post-Panamax STS cranes with 65-metre outreach handle 20,000-TEU vessels without congestion. Our VTMS integration begins vessel profiling 72 hours out. By the time mooring lines are fast, the first crane is already swinging toward the bow. Every move is timestamped to the second.
Pre-arrival VTMS profiling
Vessel data synchronized 72 hours prior — draft, stow plan, dangerous goods manifest, and reefer count all pre-loaded.
Automated crane allocation
Six STS cranes assigned algorithmically by bay density and sequence, minimizing crane crossings and idle time.
Simultaneous discharge and load
Discharge and load operations run in parallel on separate crane groups. Average vessel turnaround: 11.6 hours for 3,000 moves.
Industry avg: 3.2 days
Industry avg: 12 avg
Industry avg: 58K avg
Industry avg: 45 sec
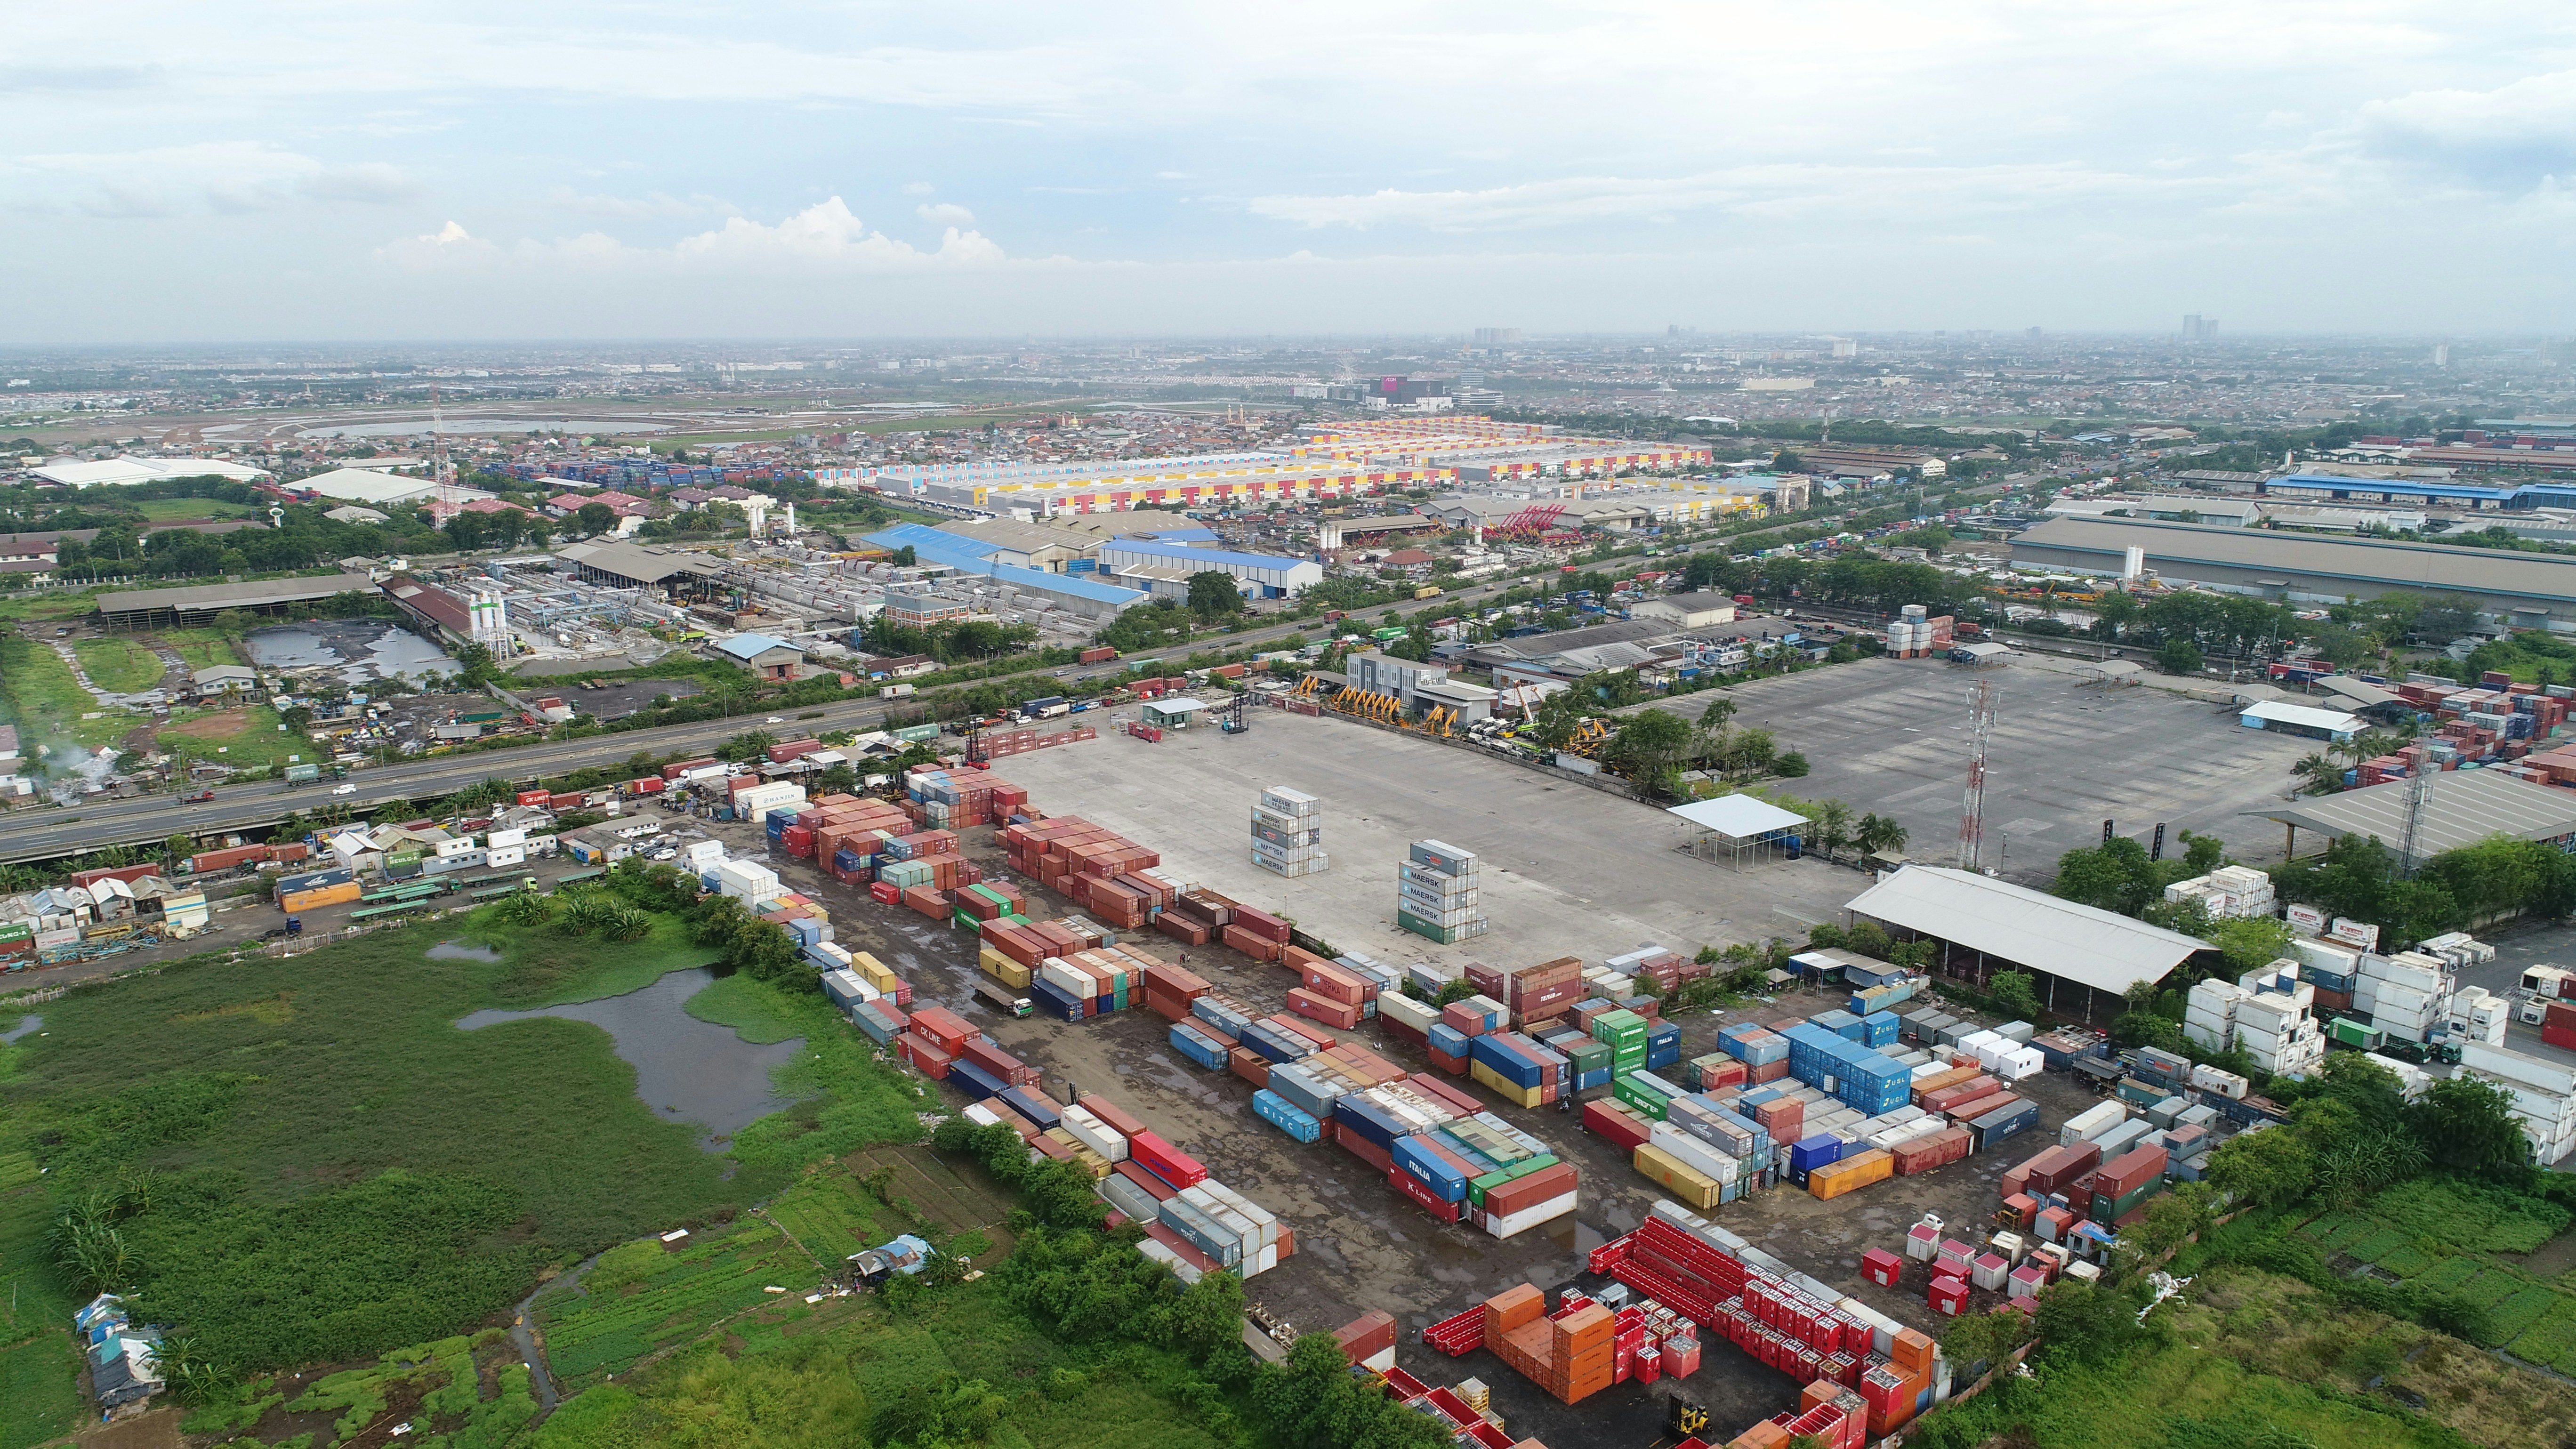
Automated stacking cranes. 1.4-day average dwell. Every box located in 8 seconds.
48 rail-mounted automated stacking cranes across 22 blocks handle 2.1 million TEU annual throughput. The yard management system pre-positions containers for next-vessel load by calculating departure probability 18 hours in advance. Dwell time of 1.4 days is not a target — it is the published median, auditable on request.
Pre-positioning by departure probability
18-hour predictive algorithm moves containers closer to the quay apron before their vessel arrives, eliminating re-handles.
Automated stacking crane sequencing
48 ASCs operate 24/7 without human intervention in the danger zone. Throughput peaks at 140 ASC moves per crane per hour.
Real-time inventory broadcast
Every BCO and freight forwarder sees their container's precise block, row, tier, and estimated gate-out window via API or portal.
Industry avg: 62 min
Industry avg: 71.0%
Industry avg: 2,800 avg
Industry avg: 94.1%
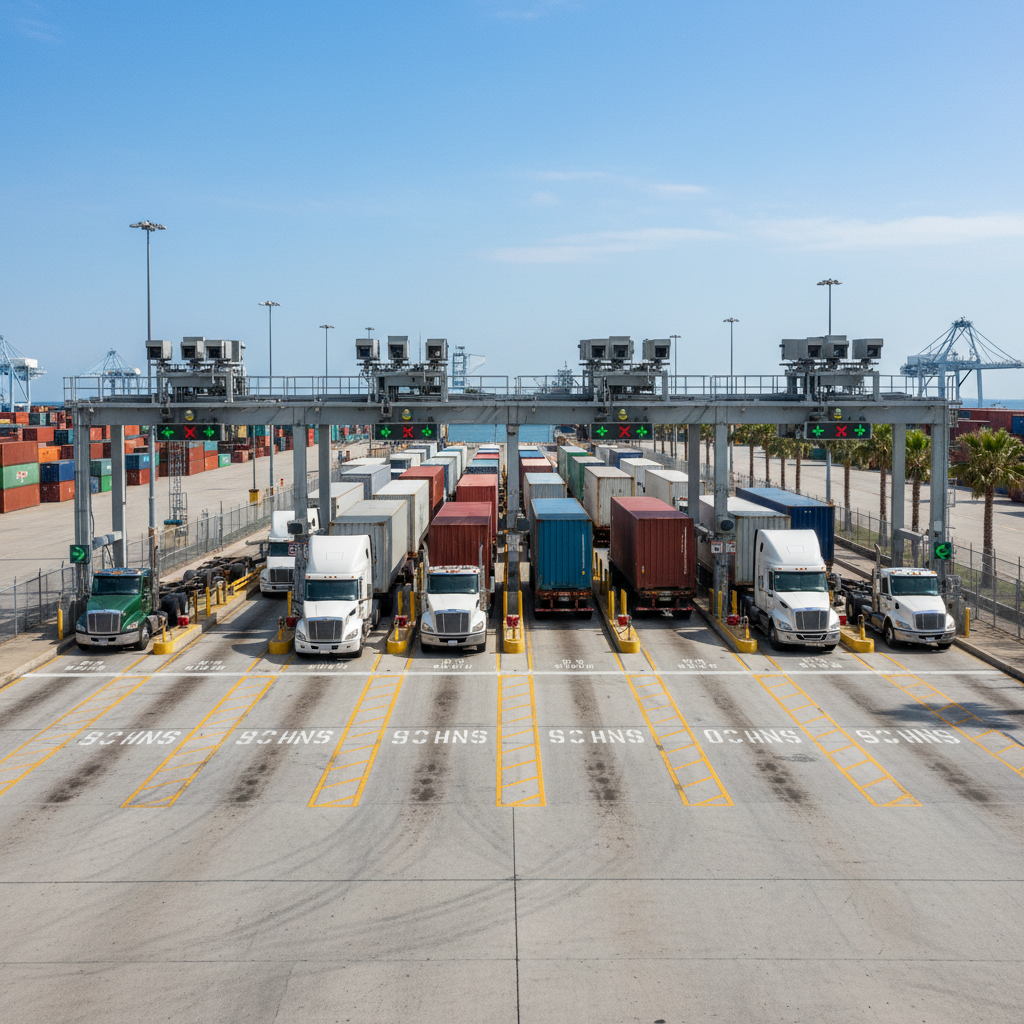
34-minute truck turn time. 96.8% appointment compliance. Zero paper at the gate.
Twelve OCR-equipped in-gates and eight out-gates process 4,200 truck visits daily. License plate recognition, container number capture, and seal verification complete automatically in under 8 seconds per lane. Appointment compliance is published weekly — the industry average is 71%. Ours is 96.8%.
Pre-gate appointment system
Appointment windows distributed dynamically across a 20-hour gate window to eliminate peak congestion. Truckers book 48 hours ahead via API or web.
Automated OCR lane processing
Vehicle, container, and seal data captured automatically at 8 seconds per lane. Zero manual data entry. Exceptions flagged to a single supervisor station.
Departure notification to BCO
Gate-out event triggers automatic notification to BCO, freight forwarder, and customs broker within 90 seconds.
Industry avg: 8.2K avg
Industry avg: 34 hrs
Industry avg: 28 avg
Industry avg: 14 avg
On-dock rail. 14,000 TEU per week. 47 inland destinations.
On-dock rail eliminates the dray from terminal to inland rail facility — the single largest cost driver in intermodal logistics. Berth's six-track on-dock facility runs 22 block trains weekly to 47 inland cities. Rail dwell at 18 hours versus the industry median of 34 hours reflects a deliberate design: containers arrive at the rail ramp pre-sorted by train and destination.
Pre-sorting by train and destination
ASC pre-sort begins 18 hours before departure. Containers arrive at the rail ramp in load-order sequence, eliminating yard-to-ramp re-handles.
On-dock loading direct from ASC
Six-track on-dock facility accepts ASC delivery directly, bypassing the port road network entirely. No dray cost, no street congestion.
Inland delivery visibility
GPS tracking and ETA updates broadcast to BCO from train departure through inland ramp arrival. Average ETA accuracy within 22 minutes.
Industry avg: 2,800 avg
Industry avg: 94.1%
Industry avg: 24 hrs
Industry avg: 2.1 avg
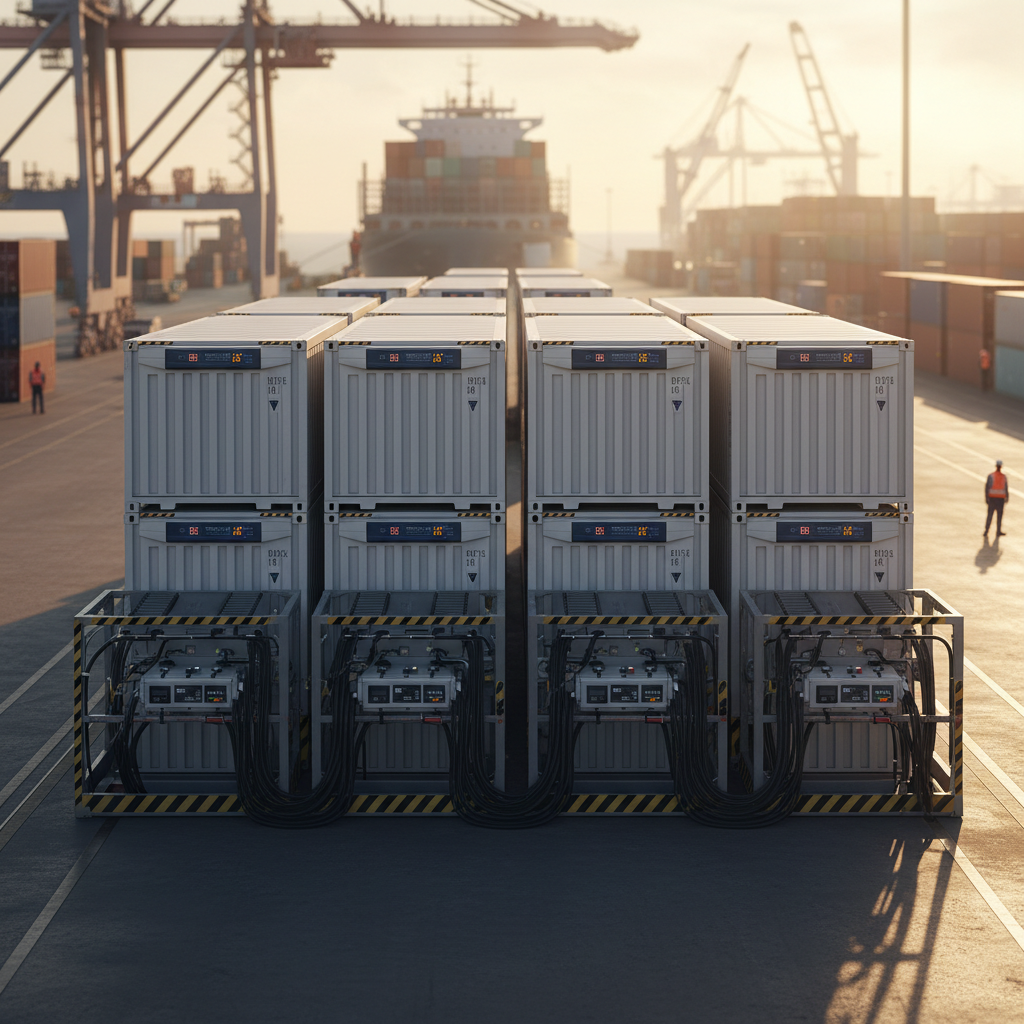
4,200 reefer plugs at 99.2% availability. Customs pre-clearance in 6 hours.
Cold chain integrity means zero excursions — not 'we investigate after the claim.' Our monitoring system logs temperature and humidity every 15 minutes per plug, with automated alerts at ±0.3°C deviation. For customs, our Electronic Pre-Arrival Processing partnership with the national customs authority achieves 6-hour pre-clearance for 94% of compliant declarations.
15-minute temperature monitoring
Every reefer plug logs temperature, humidity, and power draw every 15 minutes. Automated alerts at ±0.3°C trigger technician dispatch within 4 minutes.
Pre-arrival customs submission
Our integrated customs module submits declarations to the national authority from ship's manifest data — no importer action required for standard cargo.
Electronic pre-clearance pathway
94% of compliant declarations achieve pre-clearance before vessel arrival, meaning cargo moves gate-out within 2 hours of discharge completion.
We publish what competitors bury in the appendix.
Crane moves per hour, gate appointment compliance, reefer incident rates, customs clearance times — all published, all auditable. Run your comparison and see where every minute is accounted for.
Port Comparison
Berth vs. your current terminal
No account required. Results use published industry benchmarks.